PROFINET-INspektor® NT | PROFINET Troubleshooting & 24/7 Monitoring 124030100
Monitoring
For a quote request, please call us at +1.678.880.6910 or email info@indusolamerica.com
ⓘ Please contact us for partner and OEM pricing here.
Diagnose and Troubleshoot PROFINET Network Issues in Real-Time
Troubleshooting PROFINET network failures during production downtime costs manufacturers thousands per hour. The PROFINET-INspektor® NT diagnoses network issues in real-time—identifying telegram jitter, device failures, cable health problems, and EMC interference before they stop your line. Use it for emergency troubleshooting or continuous monitoring to prevent problems before they occur.
Intelligent PROFINET Measuring Point for Online Analysis
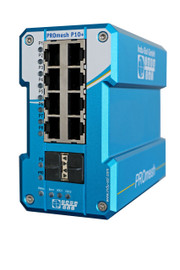
The PROFINET-INspektor® NT is a diagnostic and troubleshooting tool for certification, commissioning, and inspection of newly installed or existing PROFINET networks. Pre-defined trigger functions register and store events per device, detecting quality values like network load, data throughput, refresh rate, telegram gaps, and telegram jitter that mirror your communication quality. These parameters serve as commissioning criteria for new installations and provide critical information for maintenance and remote service.
Common PROFINET Issues the INspektor® Diagnoses
The PROFINET-INspektor® NT monitors your network continuously to detect problems before they cause downtime:
• Telegram jitter causing intermittent failures
• Network overload and bandwidth problems
• Cable degradation and EMC interference
• Device communication errors and dropouts
• Configuration mismatches and timing issues
• Telegram gaps and error telegrams
• Update time variations
• Broad/multicast loads
• Device failures and diagnostic messages
This information reflects the current status of your network's communication quality and forms the basis for condition-based maintenance. Events are tracked and stored in the device for evaluation via the integrated display or web server.
Permanent Monitoring vs. Emergency Troubleshooting
The PROFINET-INspektor® NT works both ways:
For emergency troubleshooting: Connect it when problems arise to quickly identify the root cause—whether it's jitter, cable issues, or device failures.
For preventive maintenance: Install it permanently in your network to catch problems before they cause downtime. The plant operator knows the current status at all times and receives maintenance notifications when critical changes are detected.
Key Features
- Acceptance according to the PROFINET Design Guideline and Commissioning Guideline of PROFIBUS & PROFINET International
- Independent analysis and evaluation of PROFINET real-time communication
- Topology determination incl. asset management
- Detailed description and presentation of the PROFINET network
- Complete acceptance report with all relevant event information
- Representation of the PROmesh switches
- Display of status-relevant port statistics and leakage currents
- Self-learning threshold values
- Threshold values are automatically determined for alarming after the acceptance test
- Touch display that shows errors directly
- Jitter statistics for all devices
- Option to carry out active or passive network diagnosis
- Uninterrupted monitoring, even at high net load
- Synchronization via time server
Security Features
- Detects new and unknown devices in the network
- Registers unauthorized programming or manipulation of the controller
- Identifies even the smallest peak loads in resolving network loads exact to the millisecond
- Recognizes telegram manipulation based on an increased jitter
Installation Options
Standard Installation
One PROFINET-INspektor® is required per PROFINET master system. The INspektor® loops into the connection between the IO controller (PLC) and the first device (switch) for analysis. No additional IP addresses or PLC program adjustments required—the INspektor® works in an entirely manufacturer-independent way, compatible with any control system and IO devices.
Non-Disruptive Installation with Test Access Points
For troubleshooting without downtime, use a feedback-free measurement point like the PNMA II TAP (art. no. 114090100). This allows temporary or permanent connection to monitor both telegram directions without compromising ongoing production. Connect the INspektor® to the M1 and M2 monitor ports via two patch cables—ideal for emergency troubleshooting or adding monitoring to running systems.
PROFINET Diagnostic "Agent Blond"
The PROFINET Agent – "Agent Blond" combines the functionality of a PROFINET measurement point with PROFINET analysis. In doing so, relevant parameters—such as missing update rates ("telegram gaps")—are recorded, which accelerates the identification of actual weak points within the PROFINET system. The evaluation of the recorded data does not take place on the device itself; instead, all data is transferred to the PLC. The PROFINET Agent is intended to be permanently installed within the network connection between the PLC and the first switch, as this connection carries the cyclic PROFINET communication to all PROFINET devices. Two network ports (X2P1 and X2P2) are available for this purpose.
The PROFINET Agent can also be set up to create a permanent measuring point for connecting more detailed diagnostic devices like the PROFINET-INspektor® NT. To enable a non-intrusive connection, two mirroring ports (X3P1 and X3P2) are provided.
Software Integration & Topology Visualization
The PROFINET-INspektor® NT's active scan function records up-to-date topology plans of your PROFINET/Ethernet network, including all device information, at any time.
Built-in Web Interface
Access network status directly from any PC browser—no additional software required. The embedded web server displays real-time diagnostics with visual alerts available via potential-free contact for immediate troubleshooting response.
PROscan® Active V2 - Visual Topology Mapping
Combine the INspektor® NT with PROscan® Active V2 software to visualize network status at a glance. Device status displays with traffic light colors (red, yellow, green) on an interactive topology plan for quick identification of problem areas.
PROmanage® NT V2 - Centralized Multi-Network Monitoring
For enterprise-level visibility, combine PROmanage® NT V2 software with your INspektor® units and PROmesh managed switches. This gives you centralized access to monitor multiple fieldbus and Ethernet networks, with combined diagnostic features from all devices.
Latest Firmware Enhancements (V2.5)
- Query of user-defined OID parameters from devices
- Visualization of the switching input status directly in the display and in the web interface
- Extension of the API interface
- Option of permanent mirror port activation for diagnostic purposes
- Display of individual customer logos on the display
- Various security improvements
Frequently Asked Questions
How quickly can the INspektor® NT identify the root cause of network problems?
Which PROFINET networks does it support?
What types of issues can it detect?
Can it perform continuous or permanent PROFINET network monitoring?
Does it support network topology mapping and asset documentation?
Is there a way to connect it without disrupting the network? (Measurement points)
How is the user interface designed?
Does it integrate with other InduSol tools?
How is it different from a standard network analyzer?
Who do I contact for demos or RFQs?
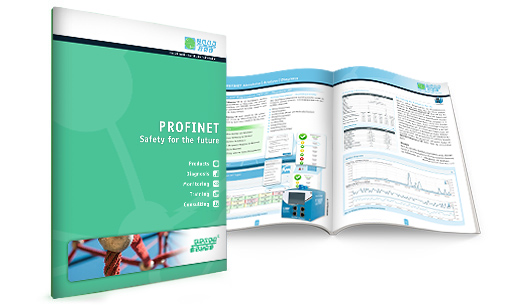
PROFINET Brochure

PROFINET - Safety for the future explains technological coherences in detail that are based on the latest valid standards and guidelines.
Download PDF


